Explore the Platform
Actionable insights, trends and industry benchmarking with InsightsIQ
Solving the shortcomings of benefits reporting for HR Leaders
Challenges with Traditional Benefits Reporting
Analyzing data is time consuming
:
;
While reports are powerful, they require effort and knowledge of spreadsheet tools to analyze before you are able to take action
Pulling together disparate data and reports
:
;
It’s difficult to see historical trends with traditional reporting because several reports need to be ran for each time period and then be aggregated together
Difficult to understand how you compare
:
;
It’s hard to know how you compare to peers without significant resources and time dedicated to conducting the necessary comparative research
Often lacks automation
:
;
Reporting progress needs to be sought out, which can create delays before you can use the data to make business decisions
Why Do You Need Data Visualization Tools?
Reports are incredibly powerful but come with their share of limitations and shortcomings. Data must be organized and analyzed before any decisions can be made. InsightsIQ is a data visualization tool that automates the data organization process and presents it in a more digestible way.
If we didn’t have PlanSource for our benefits technology, and if we didn’t have the Premium version where we have a dedicated team helping us, I wouldn’t have the time to do any strategic work. We’re saving money, because we would need one or two more of me if we didn’t have PlanSource.

NICOLE NIESWAND

Senior Benefits Specialist, MetroHealth

Improve Engagement

Easily engage with your organization’s data that is automatically pre-visualized

Analyze Faster

Better data visualization allows for quicker analysis to understand what’s really going on
Z

Make Decisions

Make more informed decisions based on your findings
Key InsightsIQ Features
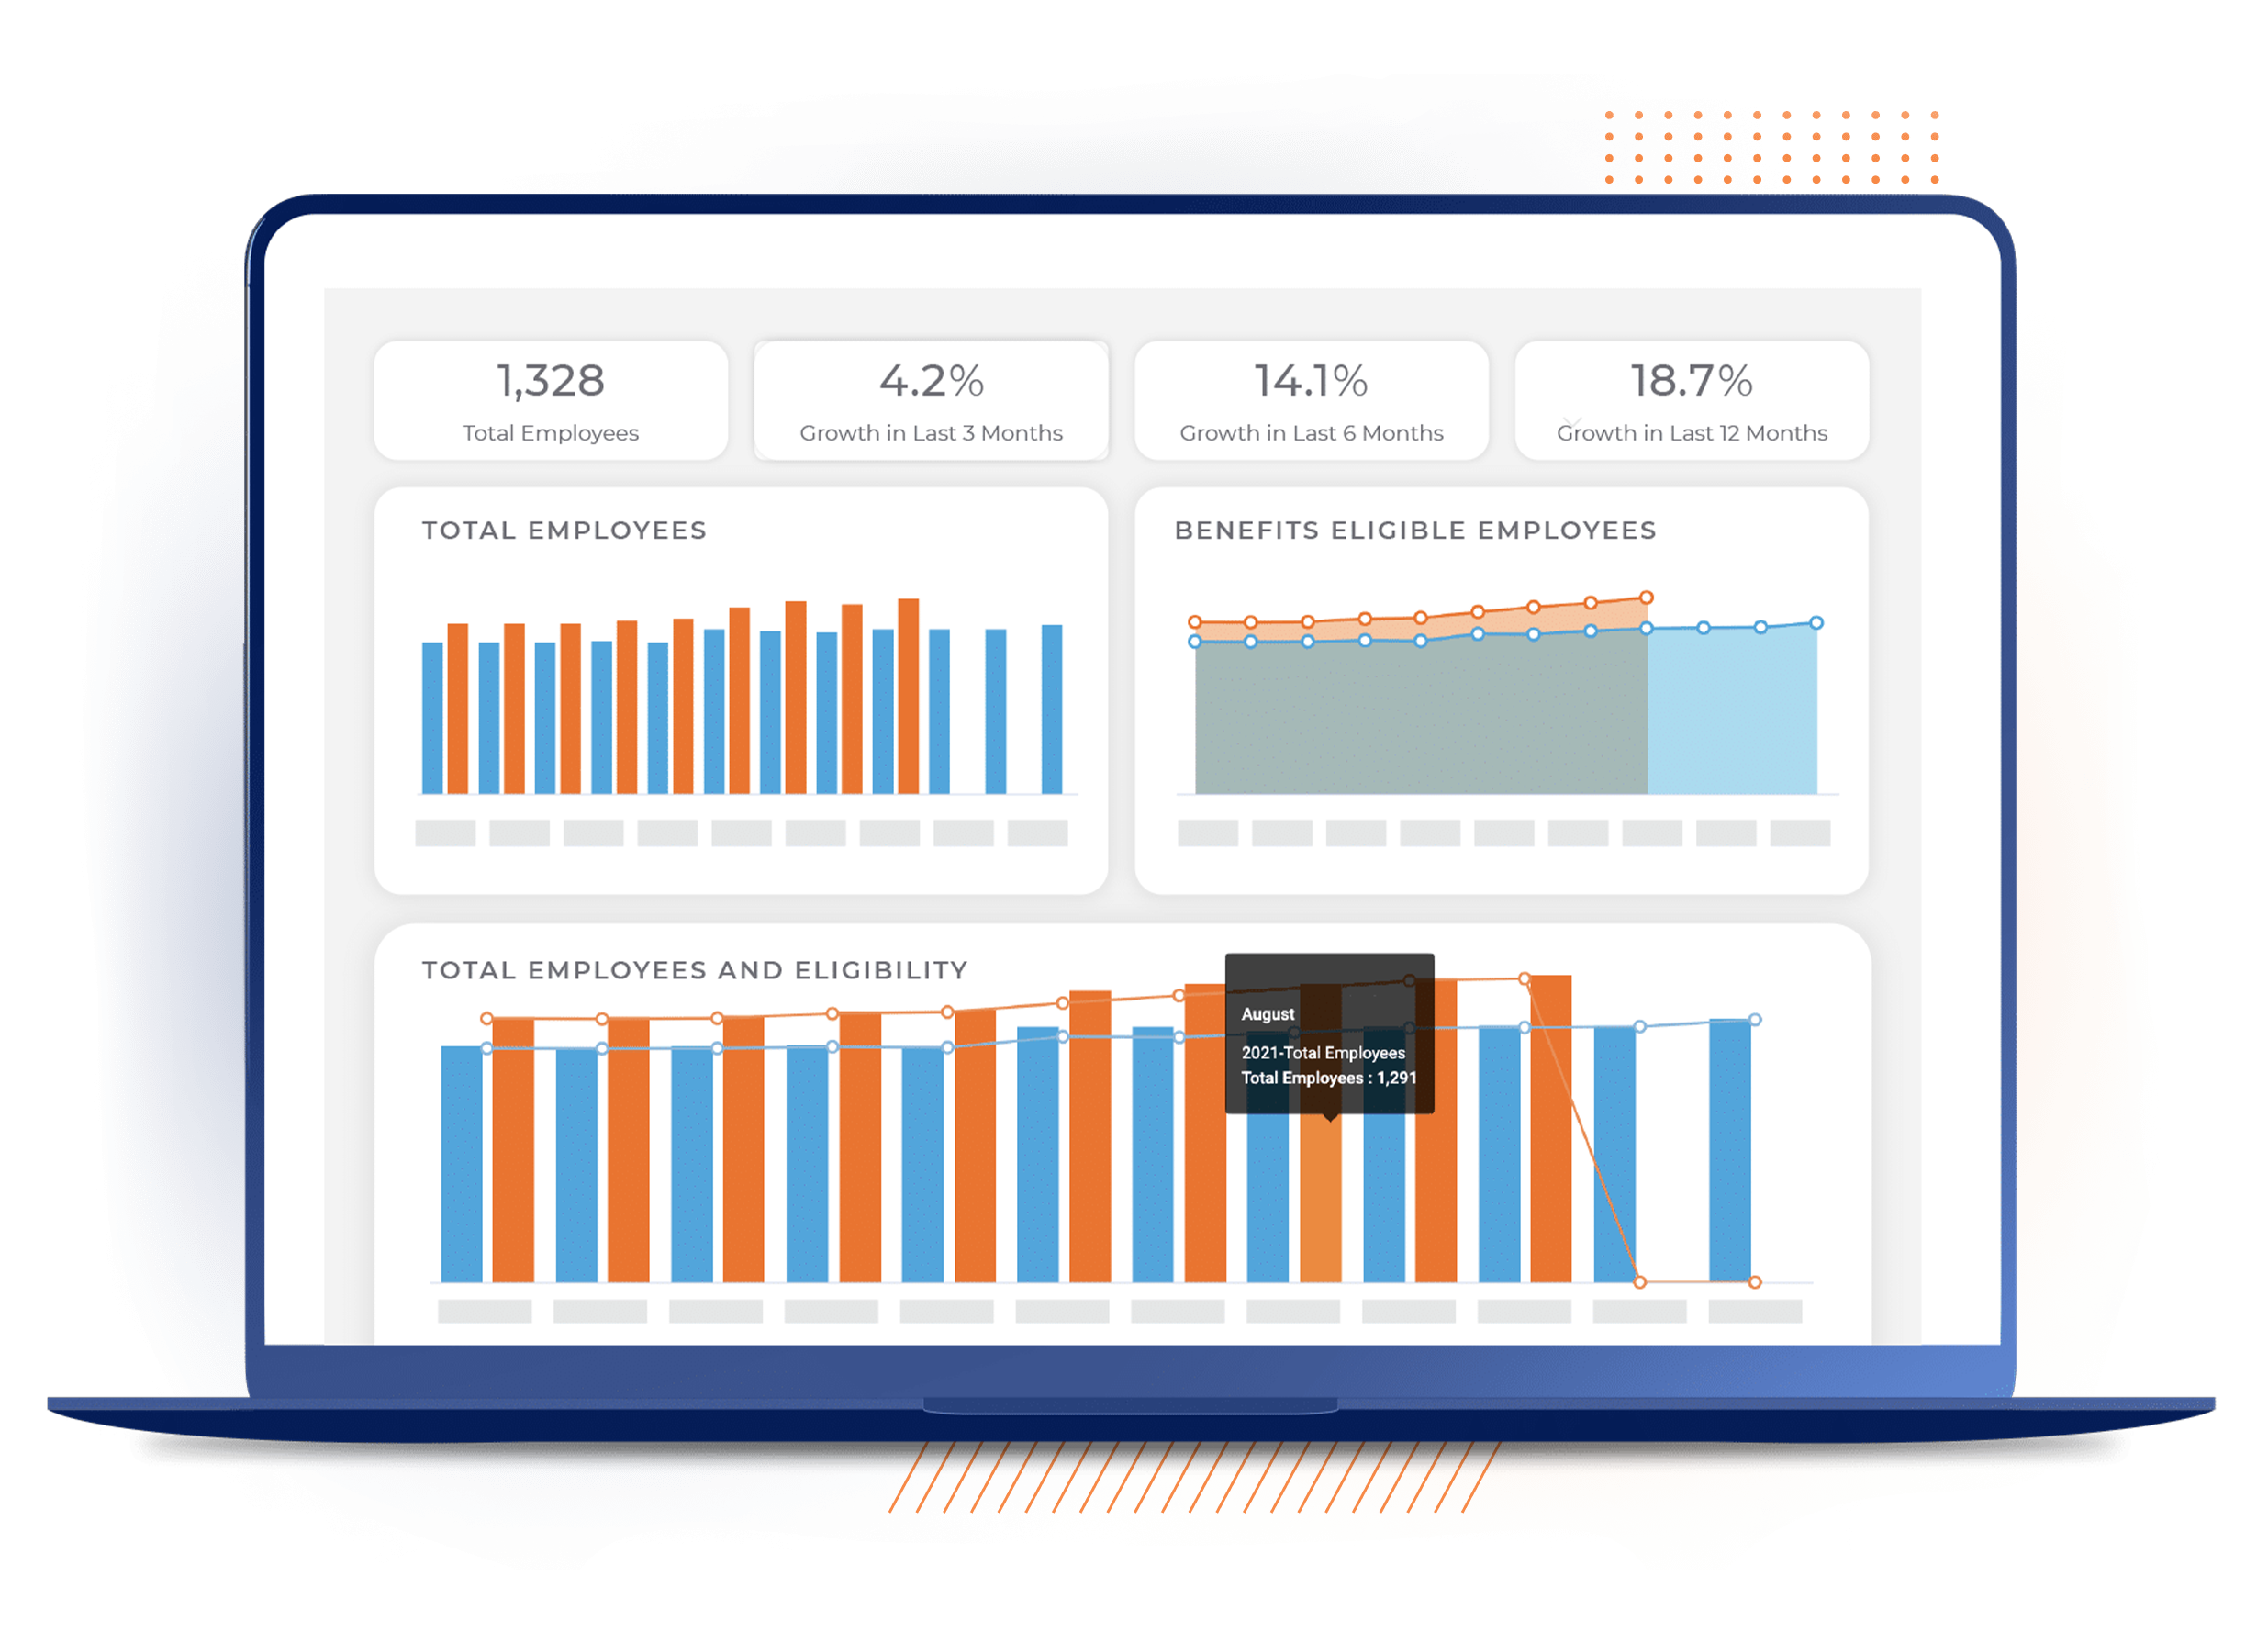
InsightsIQ simplifies the reporting process by automating data visualization so you can focus your time and energy on analysis and decision making. Supplement your existing reporting with pre-visualized data that makes it easier to take action.

Historical Trending

Have your historical data pre-aggregated and displayed in a format that allows for quick understanding of the trendline so you can better track towards a specific outcome.

Dashboard Visualizations

With InsightsIQ, you can spend less time formatting and organizing your data and focus on analyzing pre-visualized data in a readable dashboard form to make decisions.
U

Workforce Visibility

Get a clear, easy-to-drill-down look at employee demographics and how your employee population is distributed, so you can better understand their needs and overall benefit package fit.

Automatic Refresh

The data on the InsightsIQ dashboard is always up to date which means no waiting, delays or job queues. Plus, stay ahead with automated report scheduling and alerts
InsightsIQ Dashboard
Organized into 4 dashboard themes, based on the type of insight it’s delivering.
EXECUTIVE SUMMARY
:
;
Overview of employees, benefits, participation and costs to provide an at-a-glance summary of your employees and business
OPEN ENROLLMENT
:
;
Near real-time open enrollment election tracking that automatically updates as OE progresses
BENEFIT COSTS
:
;
Distribution of costs per benefit between employer and employee, helping you ensure benefit package competitiveness for recruiting and retention goals

Coming Soon
EMPLOYEE DEMOGRAPHICS
:
;
Breakdown of how your employee population is distributed to help you better understand their needs and overall benefit package fit
DependentIQ
Instant, AI-driven eligibility verification
DecisionIQ
Prescriptive, AI-based decisions engine
InsightsIQ
Powerful benefits insights at your fingertips